Visualization and Manipulation
AWS Blu Insights provides dependencies analysis for multiple languages with advanced visualization (Graph/Table) and manipulation features. In the Dependencies tab of Assets, it is possible to select a technology among a large list of supported languages (continuously enriched). For each language, AWS Blu Insights handles a set of statements to detect dependencies between files based on their types.
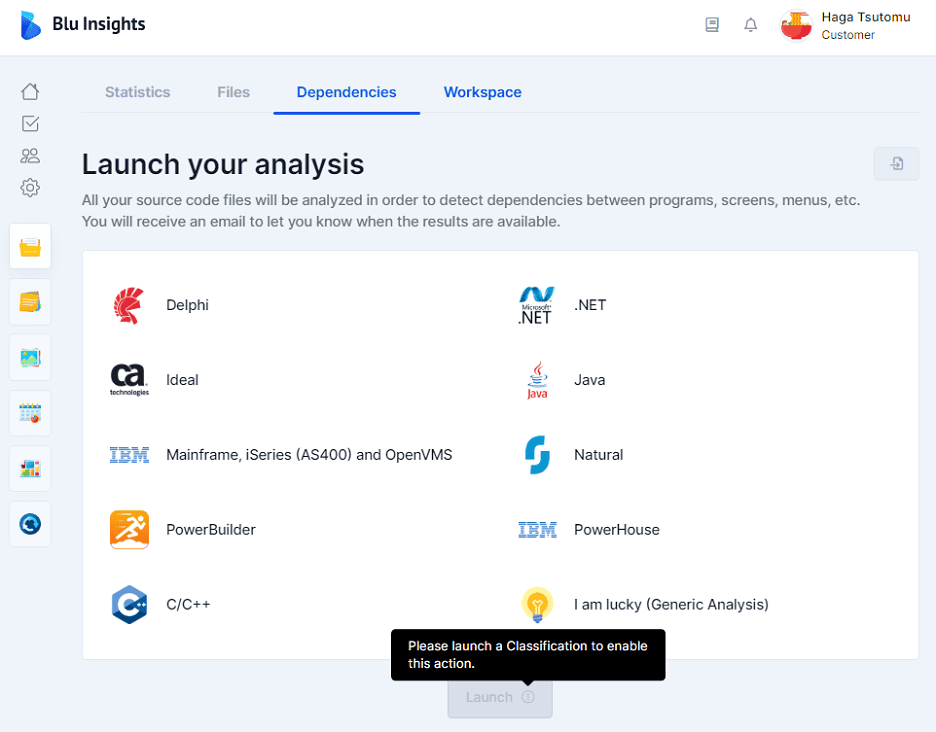
The dependencies analysis relies on the classification (if some or all files have no extensions or a .TXT one) to properly handle file types. In such cases, the user will not be able to launch the dependencies until the classification has been done.
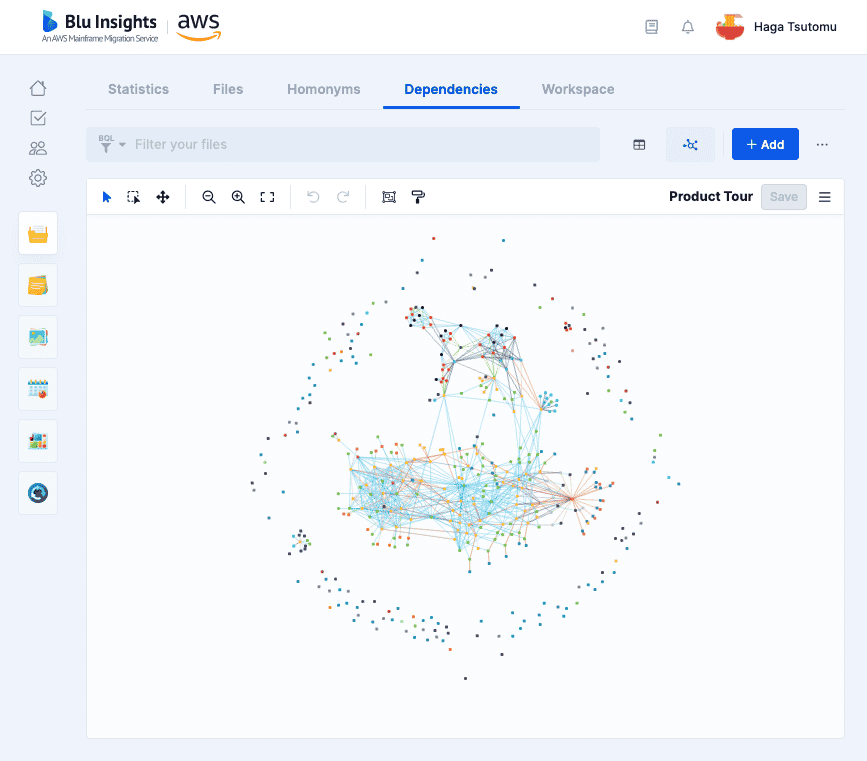
When the dependencies analysis is completed, the results are displayed both as a graph and a table of the analysis. It is possible to switch from one to the other by clicking on the icons at the top right of the page as shown in the following image.
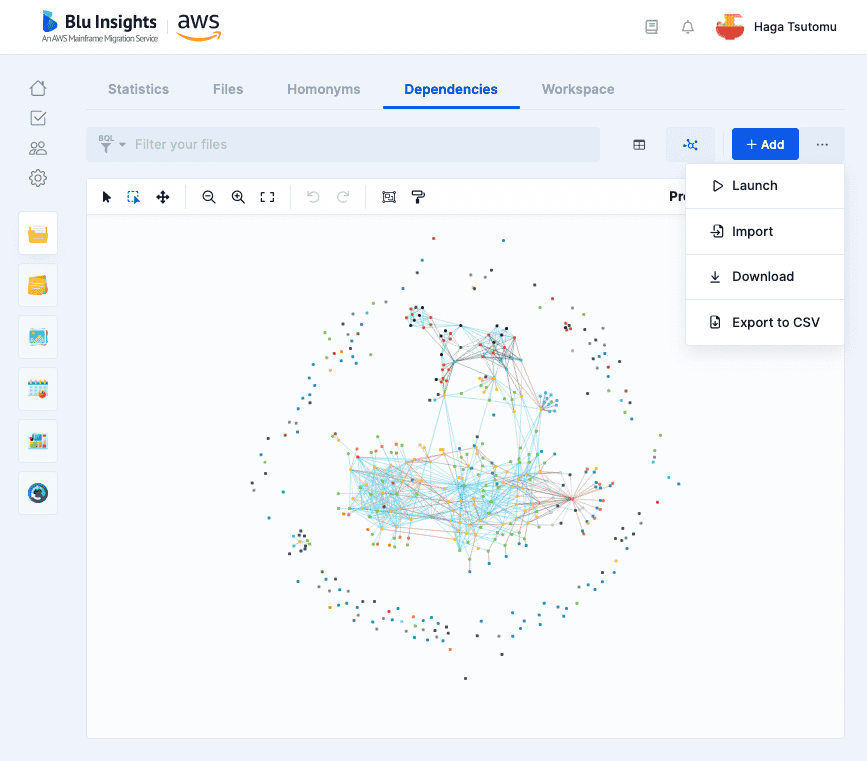
The “…” icon opens a menu that allows relaunching the analysis (e.g. after updating the codebase) or importing your own dependencies using a JSON file. An orange exclamation mark on this Launch button shows that one or multiple files have been deleted or added (using Catch-up) and the current dependencies analysis is outdated and needs to be relaunched.
It is also possible to export the result to a CSV or JSON file.
The dependencies analysis contains mainly the codebase files and extra elements called nodes that are mainly of two types: Missing (i.e. not found on the source code files) and System (calls to libraries or routines related to the platform). Those types can be edited using the Selection Properties.
Table View
In the table view, the files are listed in a tree with their dependencies (if any) as nested elements. All the actions performed on a given file are automatically updated for all the instances of the same file. Similarly to all the other pages, it is possible to filter the content of the table, export it, and select files in order to edit their properties, view their content, or delete them.
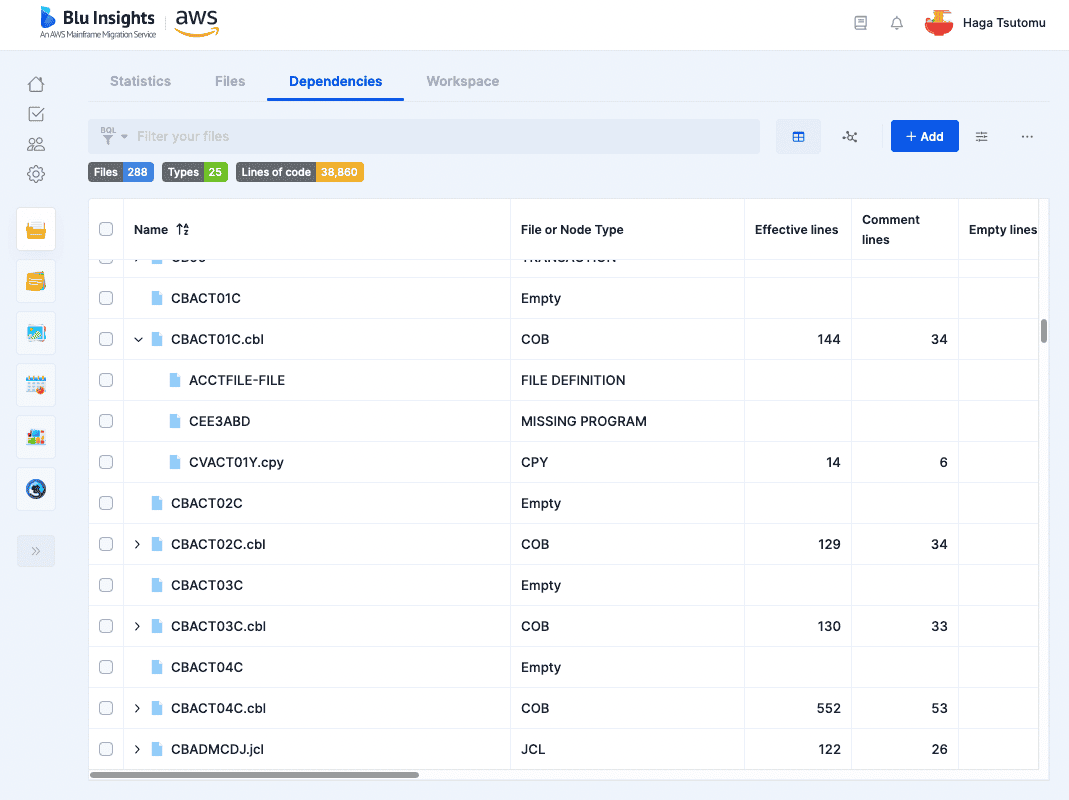
This table contains a special column called “Velocity” based on System Utilities inputs. For each System Utility, identified by the dependencies analysis, this column indicates whether it is supported, not required or not supported.
Graph View
The dependencies result are presented as a set of nodes and edges with unique properties (type, color, name, etc.). The nodes represent the files or Missing/System artifacts and the edges represent the relationships among all of them. Hovering the mouse over nodes and links opens informative tooltips (name, path, type, etc.). Similarly to the table view, it is possible to select any node (Ctrl + Click) to edit its properties or view its content if related to a source code file.
More actions allowing a user-friendly manipulation of the graphs are proposed on the top of the graph.
- Direct, Rectangle and Drag modes
The first 3 icons allow to choose how the mouse should behave on the graph. It is possible to switch between:
- the default selection mode allows to select and move nodes (“Ctrl+a” shortcut selects all the nodes).
- the rectangle mode draws a rectangle to select embodied nodes.
- the drag mode allows to move selected nodes by clicking anywhere in the graph (extremely helpful when looking for a few nodes in very large graphs).
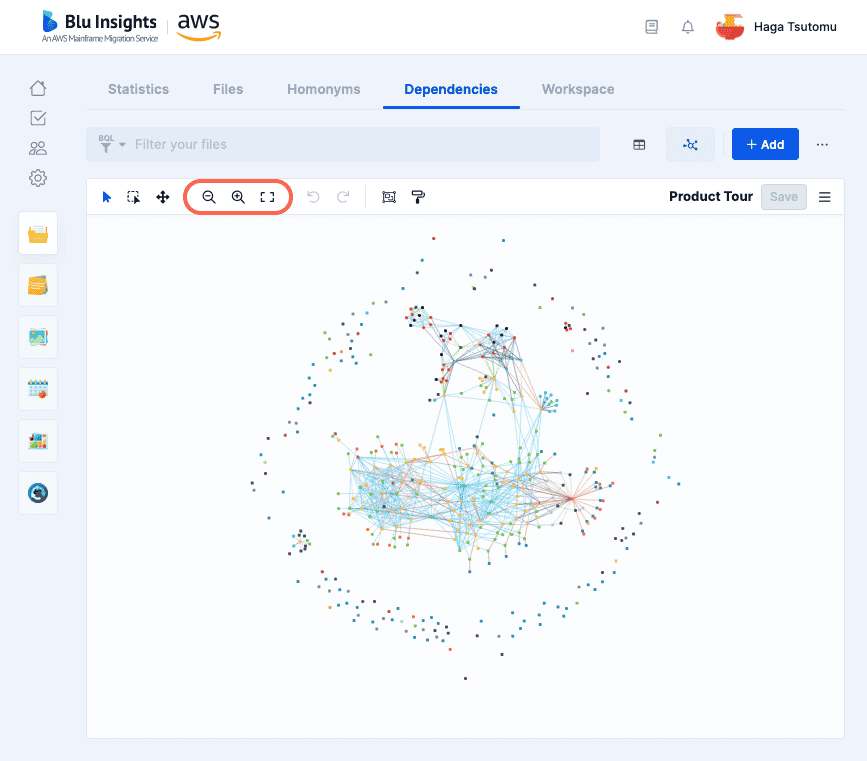
- Zoom
These buttons allow to zoom out, zoom in (also possible with the mouse wheel), and reset zoom that fits the graph.
- History
Previous actions can be undone by clicking on the first arrow or using the “Ctrl+z” shortcut. The second arrow allows to redo the undone actions (“Ctrl+y”).
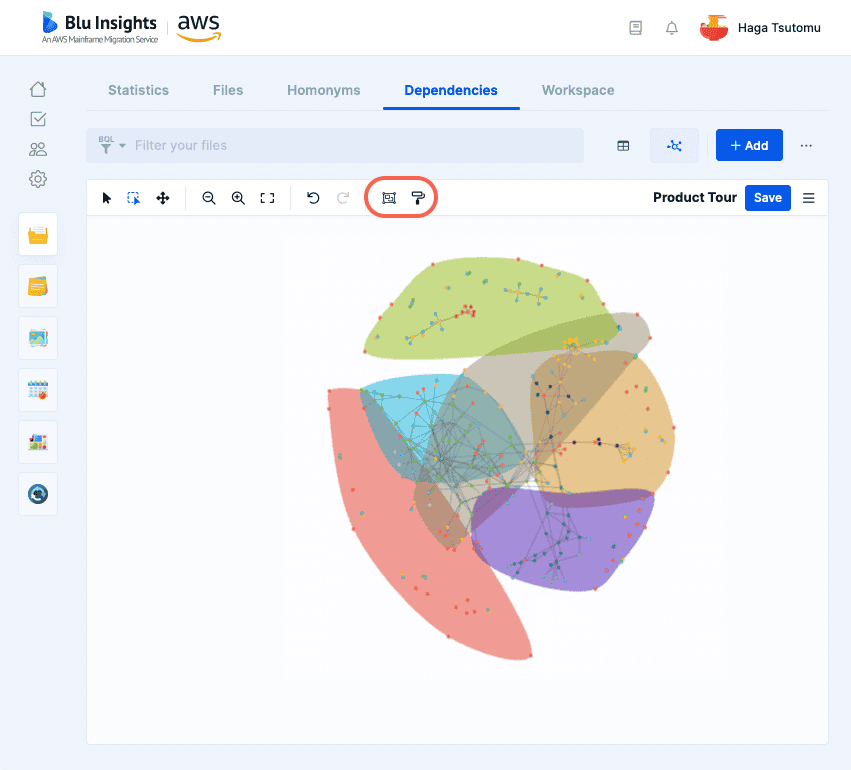
- Visual preferences
It is possible to hide/show colored containers for a selection of nodes sharing the same Workpackages, Labels, File Types, or Status. The color of each container is defined when created in their corresponding pages or in the Selection Properties.
Each node and edge have a default color based on their types. This default color is unique for each project. Colors can be changed for a better customized visualization. Node colors can also be based on their status.
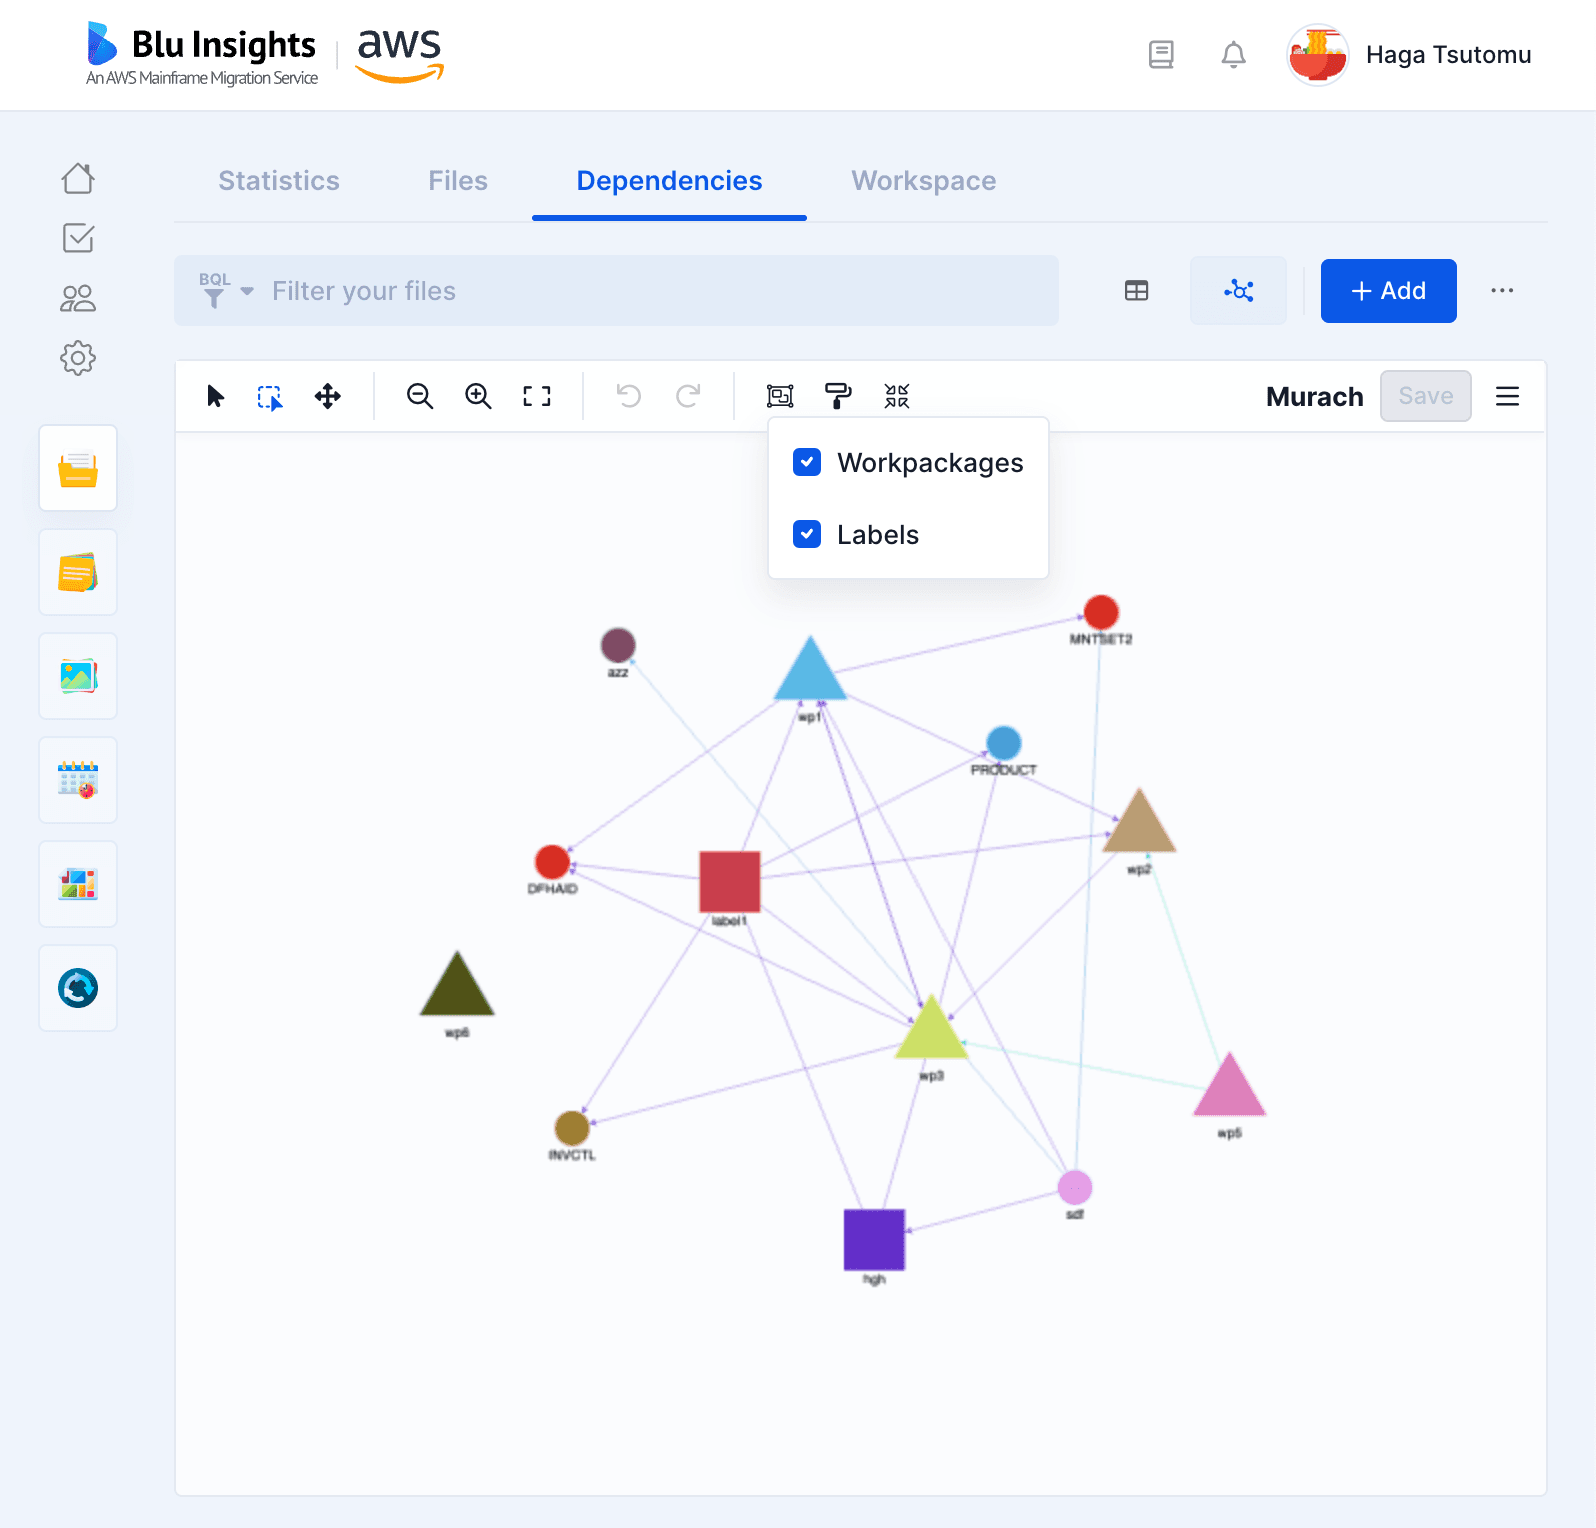
- Group by Labels or Workpackages
Nodes can be grouped by Labels, Workpackages, or both. This will allow to zoom out of the details of the files and get a high level view of the relationships among the aforementioned artefacts. Workpackages are represented by triangles, and Labels are represented by squares. Also, edges between nested Workpackages or files will be added accordingly.
- Copy names
When one or more nodes are selected, it is possible to copy their names. The copied content is put in a row, separated by a comma, and copied to the clipboard. You can paste this text wherever you need.
- Layout
It is possible to apply organic or hierarchical layouts on a selection of nodes to better visualize the graph.
Subgraphs
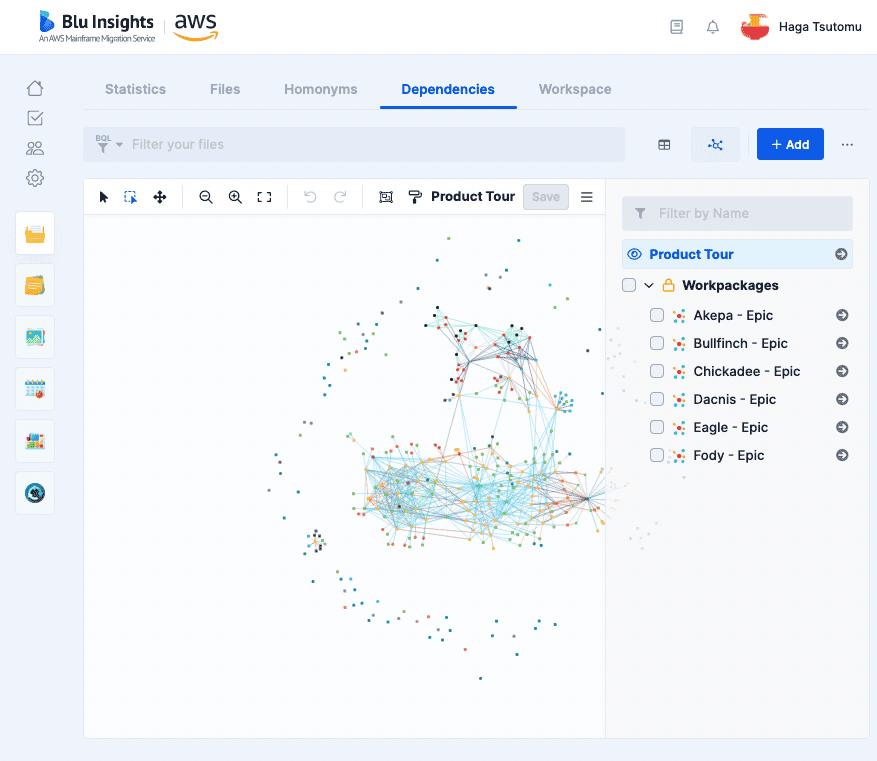
A selection of nodes can be extracted to new subgraphs or merge them with an existing one. Each subgraph has a name, a group and a description. The groups are by default private, i.e. only visible by their creators unless they are explicitly shared. All the graphs are organized into groups and are accessible in the menu on the right-hand side of the graph. The currently displayed graph is highlighted. Extra actions for subgraphs are proposed on the top menu.
- Node visibility
The eye and crossed-out eye buttons allow to choose the nodes to be hidden or shown in the subgraph based on the selection.
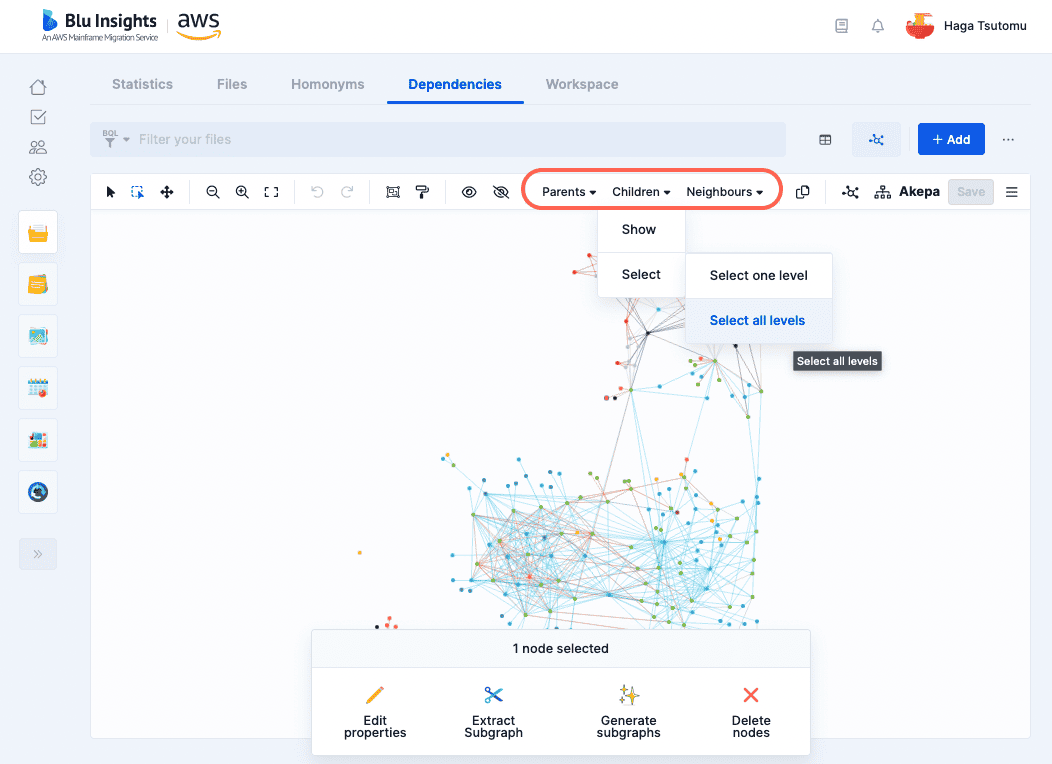
- Children and parents
For one or multiple selected nodes, it is possible to select the parents/children from the subgraph nodes or show the parents/children not already in the subgraph. You can apply these actions at one level or at all levels.
Nodes & Files
The graph is mainly made of edges and vertices. The user manipulates 2 different types of vertices:
- Files: they are linked to the physical files that have been uploaded by the user into the project.
- Nodes: they are related to virtual nodes to represent: missing artifacts, system utilities or data/file names.
Add & Delete Nodes/Links
Nodes and links can be added to the graphs with properties such as color, name and type. Nodes can be deleted by selection and a link can be deleted by selecting two nodes.
Filtering options
Both of the Files and Nodes can be filtered using their respective filters. The dependencies analysis generates default filters to allow an immediate navigation into specific nodes (e.g. missing programs, SQL nodes, isolated programs, etc.). By default, these filters are shared with all team members and are visible in “My Stuff”.
- Defaults Filters:
- Dependencies – Entry Points: “indegree = 0 and outdegree > 0“. Retrieves all vertices without parents and at least one child.
- Dependencies – Files Nodes: “node type in [‘FILE_DEFINITION’,’DATASET’]“. Only if you launch a Mainframe dependencies analysis, retrieves all nodes with type ‘FILE_DEFINITION’ or ‘DATASET’.
- Dependencies – Isolated: “indegree = 0 and outdegree = 0“. Retrieves all vertices with no links.
- Dependencies – Low-Level Routines: “indegree > 10 and outdegree = 0“. Retrieves all vertices with over 10 parents and no children.
- Dependencies – Missing nodes: “node type like ‘missing’“. Retrieves all nodes with the word “missing’ in their type, such as “Missing Dataset”, “Missing Program”, “Missing Database Object”, etc.
- Dependencies – SQL nodes: “node type like ‘SQL’“. Retrieves all nodes with the word “SQL’ in their type.
- Dependencies – System nodes: “node type like ‘system’“. Retrieves all nodes with the word “system’ in their type.
- Name Like: “name like “”“. Facilitates searching by vertice’s name.
- Other examples:
- Create : “link type in [‘Insert query’, ‘Write file’ , ‘Exec CICS Write file’]“
- Read : “link type in [‘Select query’ ,’Select SQL assignment’ ,’Read file’ , ‘Exec CICS Read file’ , ‘Exec CICS Readnext file’ , ‘Exec CICS Readprev file’]“
- Update : “link type in [‘Update query’ , ‘Rewrite file’ , ‘Exec CICS Rewrite file’]“
- Delete : “link type in [‘Delete/Drop query’ ,’Delete file’ , ‘Exec CICS Delete file’]“
The examples above show how to identify CRUD operations on data/files for Mainframe languages. The user can make the combinations according to their needs (e.g. use only link types for data or files without mixing them).