My Dashboard
My Dashboard contains consolidated metrics about all project artifacts. It is mainly a list of filtrable cards, charts, and histograms. Each new project contains one minimalistic dashboard that can be fully customized.
Users can fully manage their dashboard by:
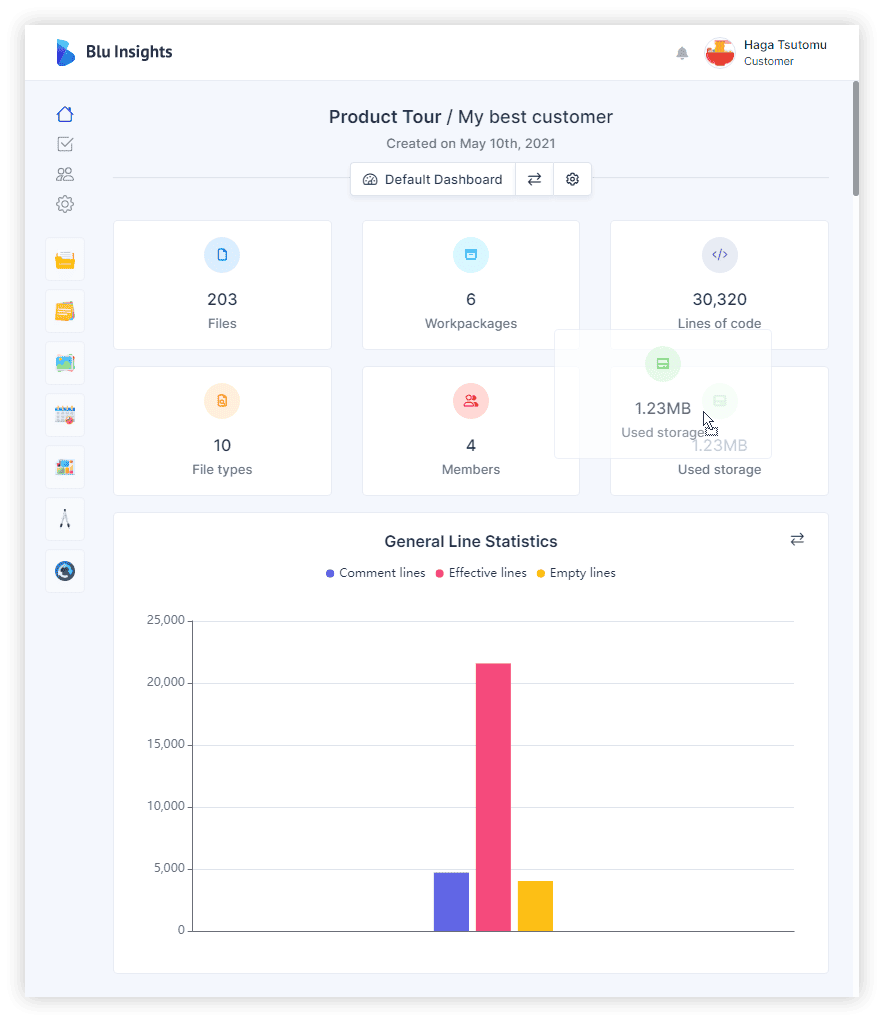
- organizing elements through drag & drop (click on the title of the element and move it to the desired position).
- switching between charts and histograms (click on the double arrow icon on the top right corner of each element).
- adding, removing elements, or filtering their content on Dashboard Settings
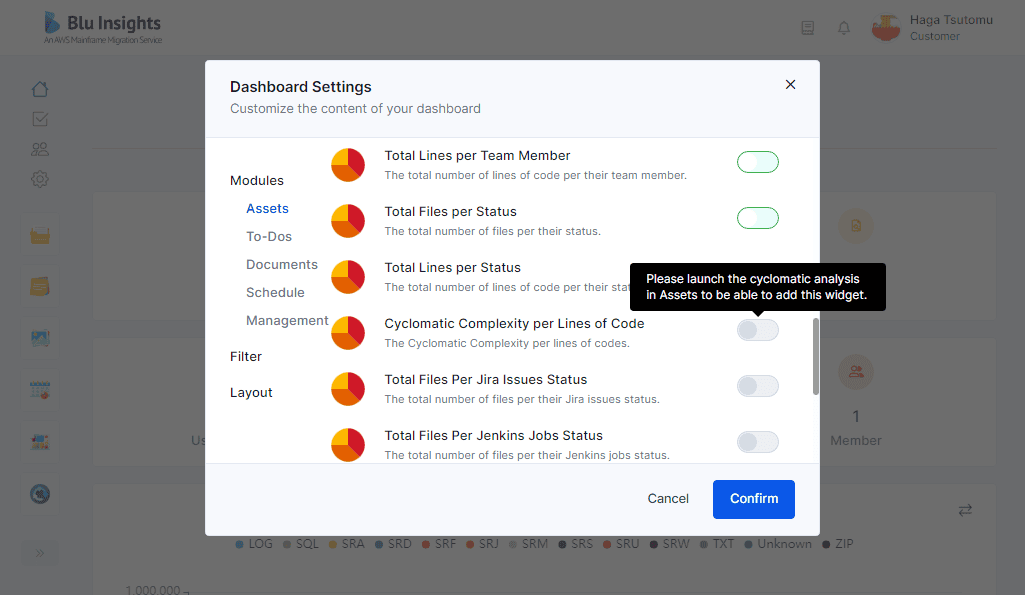
On Dashboard Settings, the elements (cards, charts and histograms) are sorted into modules corresponding to the project module, such as Assets, To-Dos, Documents, etc. Click on the module name to see the elements associated with this module. You can add or remove elements by checking toggles. If a toggle is disabled, its element requires an action, such as the launch of Cyclomatic Complexity for the “Cyclomatic Complexity per Lines of Code” graph. See the tooltip on the toggle to know what action is required.
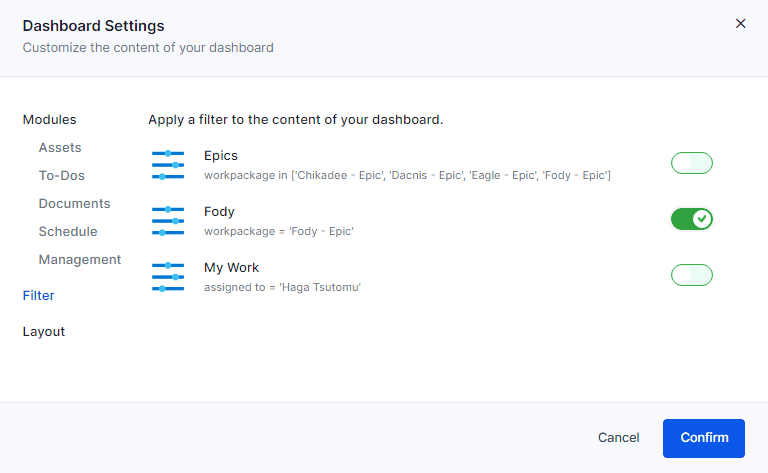
Dashboard Settings give you the possibility to filter the content of your dashboard. Click on “Filter” on the Dashboard Settings menu, then select a filter on the list by clicking on the toggle. It will apply the selected filter on the dashboard. Only one filter can be active, selected one will deselect the others. On My Dashboard page, the word “filtered” next to the dashboard name highlight a filtered dashboard.
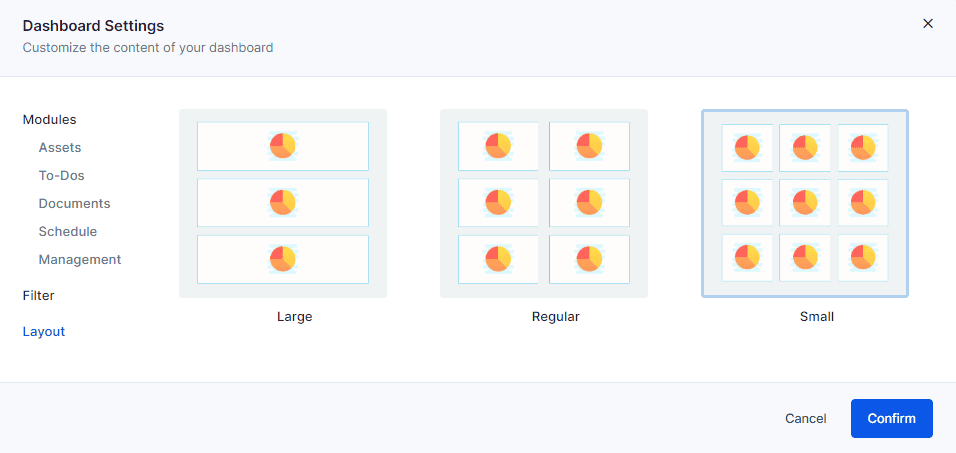
The “Layout” entry in the Dashboard Settings menu offers you three choices of layout: large, regular and small. Switch between them to adapt your elements’ distribution on the dashboard.
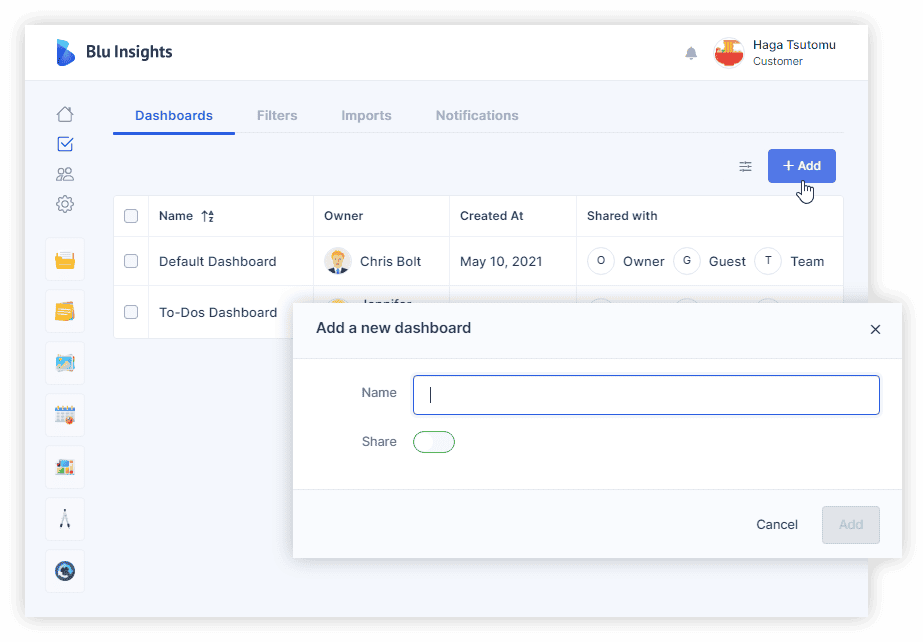
It is also possible to create more dashboards and decide whether they are private or shared and with whom (in My Stuff). You can, later on, switch between your dashboards.
To switch between multiple dashboards, click on the Dashboard Display option on the dashboard page and select the dashboard to display.