Welcome to the recap of this summer’s most exciting updates to everyone’s favourite AWS Blu Insights feature: dependencies graphs.
Graphs on the Fast Track
Since the end of July, we've achieved a remarkable enhancement in the speed of navigating and adjusting zoom levels for large graphs: a whopping 10-fold improvement.
This substantial leap forward was made possible by a straightforward change: ceasing to display tooltips for node and link intersections at higher zoom levels, exemplifying the "Invent and simplify" leadership principle. 🙌
Additionally, we diligently pinpointed and eliminated redundant graph rendering calls, resulting in a remarkable reduction of up to 20x fewer render calls in total. 🚀
Reflections on a brief innovation endeavor
Unfortunately, not every idea we explore finds its way into our final product. Today, we'd like to provide you with a glimpse into an example of an enhancement that didn't make the cut: the R-tree spatial index for intersections.
This particular idea was pursued with the aim of enhancing cursor interactions with nodes and links, as well as improving the computation of nodes inside the selection rectangle and nodes within the viewport, among other functionalities.
The prototype implementation was undoubtedly impressive, showcasing remarkable performance. However, it presented a significant challenge in the form of a substantial overhead when managing the movement of a large number of nodes simultaneously. Finding effective means to mitigate this update cost proved to be non-trivial and would have introduced substantial complexity to the product.
After careful consideration, we have chosen not to incorporate the R-tree index into our product at this time.
We firmly believe the efforts and insights gained from this exploration will not go to waste and will inform our future innovations and continue to pay dividends in our ongoing quest for product excellence. 💪
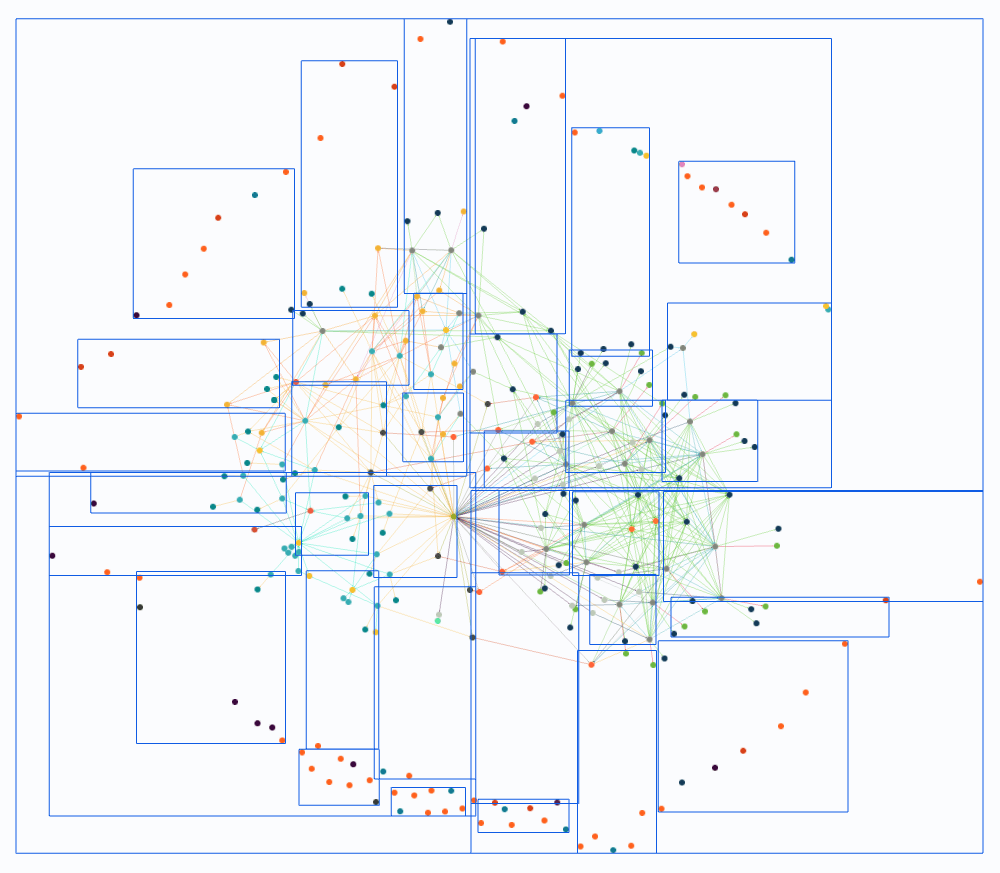
Organic layout just got smarter
If you’ve worked with graphs on AWS Blu Insights, then you've likely encountered the need for an organic layout, especially after rearranging nodes positions or extracting subgraphs. Due to browser resource constraints, the existing organic layout had limitations.
As of September, we've introduced a powerful new addition to your toolkit: Smart Organic Layout. 🎉
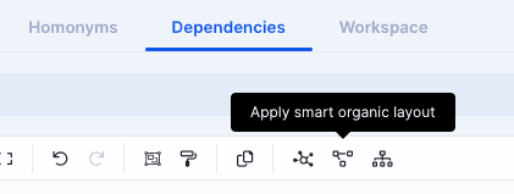
This is the same robust layout algorithm previously reserved for generated graphs, and it's now seamlessly integrated into the graph's user interface. You can apply it to any selection of files and nodes, allowing you to extract visual insights effortlessly.
Give it a try today, and see your subgraphs come to life like never before. 🌱
Graph shearing: The pre-fetch filter to the rescue
For many of our large projects, complex graphs play a pivotal role. However, they can present loading challenges on certain machines. We've heard your concerns, and we've taken them seriously.
As of late August, we're excited to introduce a game-changing feature: Pre-fetch filter pop-up. 🎉
This feature is designed with one clear objective: to empower you to work seamlessly on projects with large graphs, regardless of your machine's power.
The pre-fetch filter pop-up is an intelligent feature that steps in precisely when you need it. If our system detects that the graph you're about to load is substantial in size, it will automatically display the pop-up. 🦾
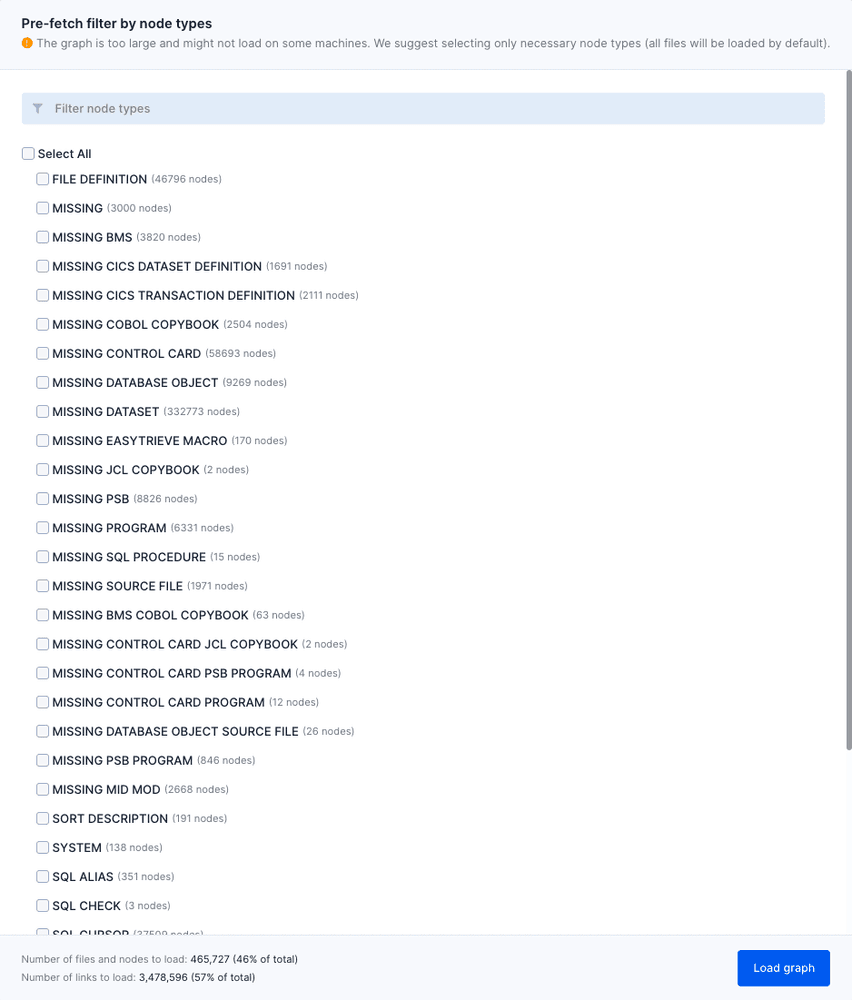
In the pop-up, simply handpick the node types you wish to include in your graph, leaving behind what you don't need. Only nodes matching your chosen types will be loaded. Files, on the other hand, will all be loaded by default.
Once you're satisfied with your selection, simply click on “load graph”. Your graph, now streamlined and tailored to your needs, will load seamlessly and can be manipulated and interacted with just like any other graph.
For additional details on the pre-fetch filter pop-up, please consult the accompanying documentation.
The Graph Guru's Secret
Naturally, we wouldn't dare wrapping up this article without offering you a valuable gift: A practical power-user tip you can start implementing today. 🚀
For your most ambitious projects, consider exporting your dependencies and re-importing them into a clean, file-free project. This simple yet powerful technique not only allows you to load larger graphs but also significantly accelerates the loading times of your existing ones.
Still skeptical? Recall the graph we unveiled last month, boasting an impressive 1.5 million nodes and 5 million edges. It effortlessly came to life through this very approach.
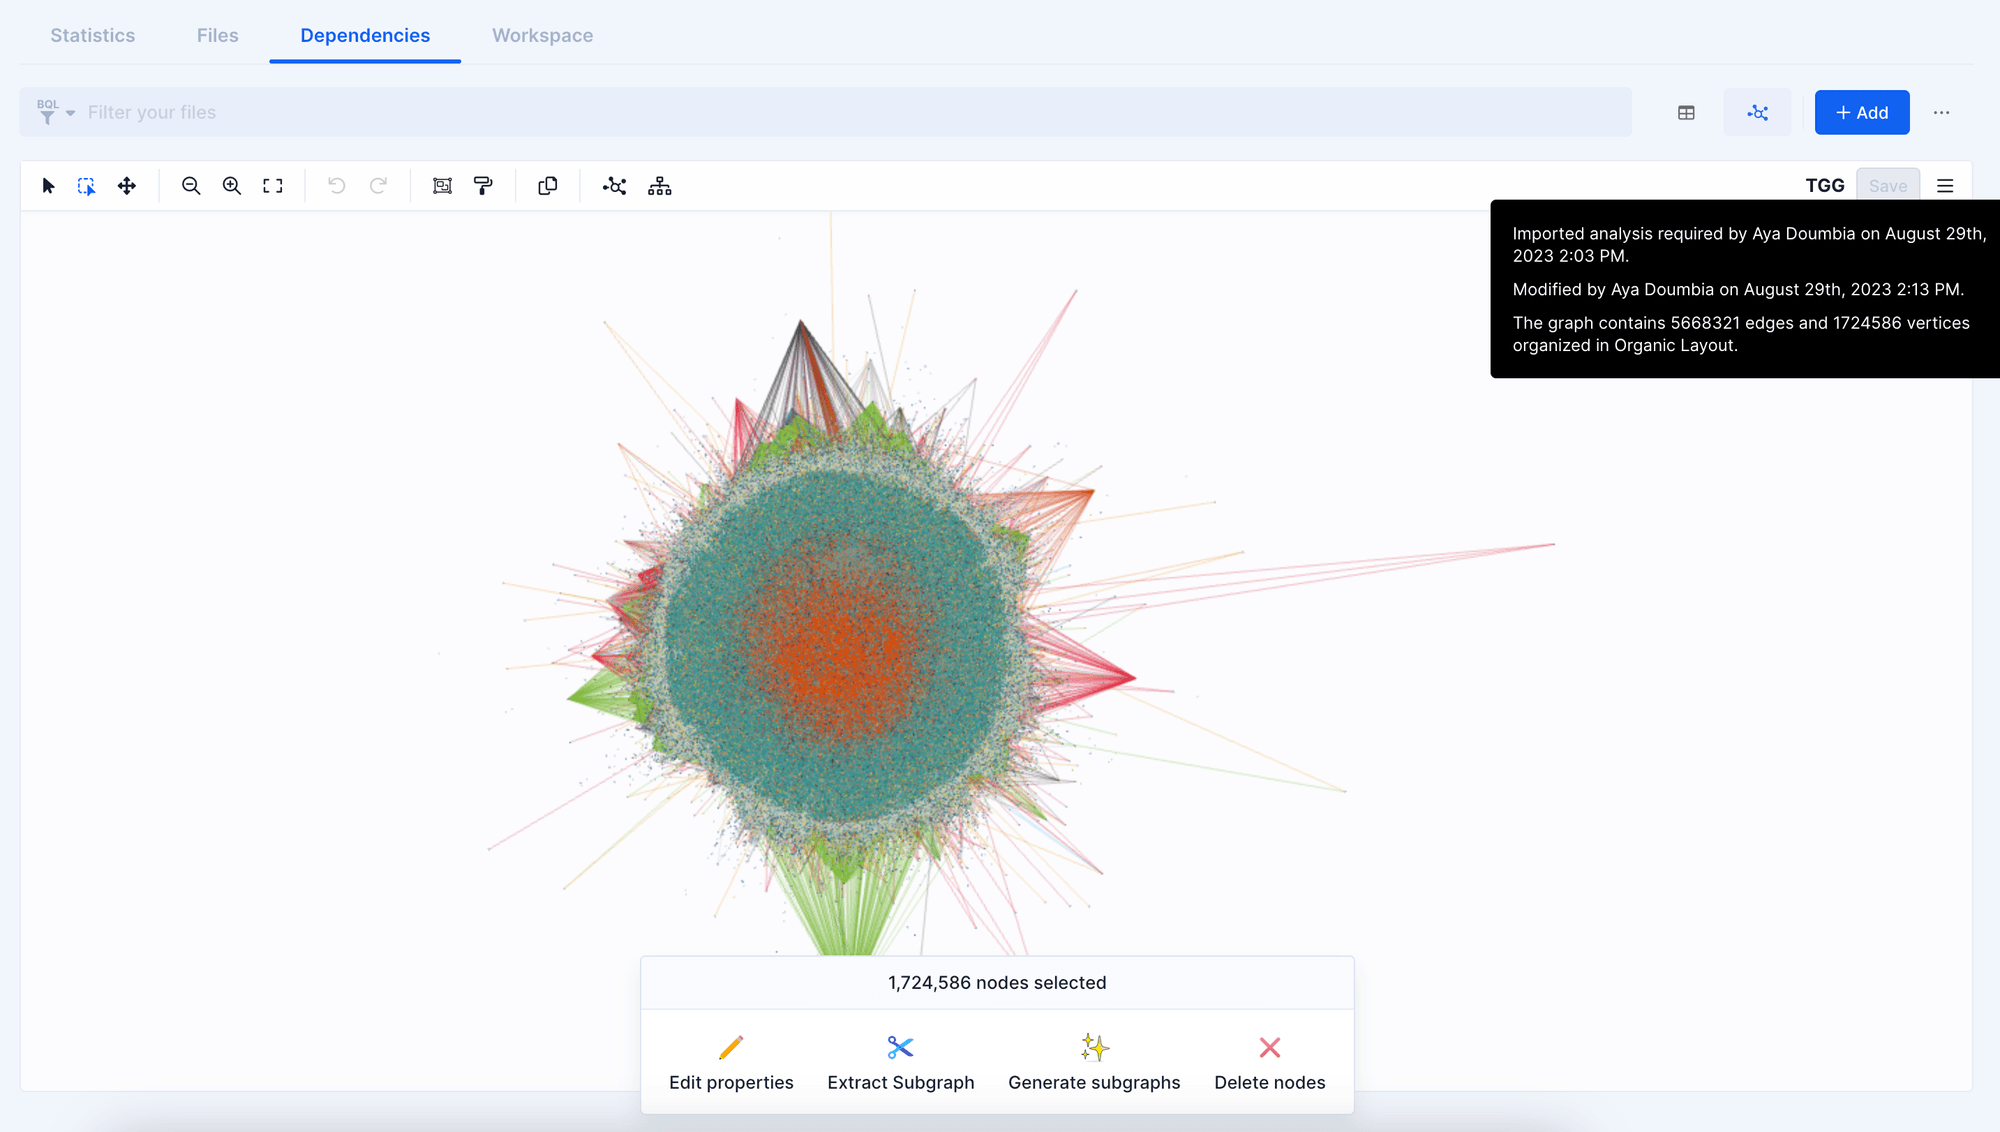
In fact, we've found this particular trick to be so immensely helpful that we’re making it into a dedicated service 🤫
Give it a try today, your largest graphs will thank you!
The collaboration tale Cont'd
As we bid farewell to the warm days of summer, we eagerly look forward to the challenges and opportunities that the future holds. We remain dedicated to our mission of continually improving our app and providing you with the tools you need to thrive in your projects.
Your feedback has been invaluable in shaping these enhancements, and we encourage you to keep sharing your thoughts and ideas with us. Together, we'll continue to make AWS Blu Insights an indispensable asset for your work. 🤝
Thank you for being a part of our journey. Keep your seatbelts fastened for an exhilarating ride ahead!