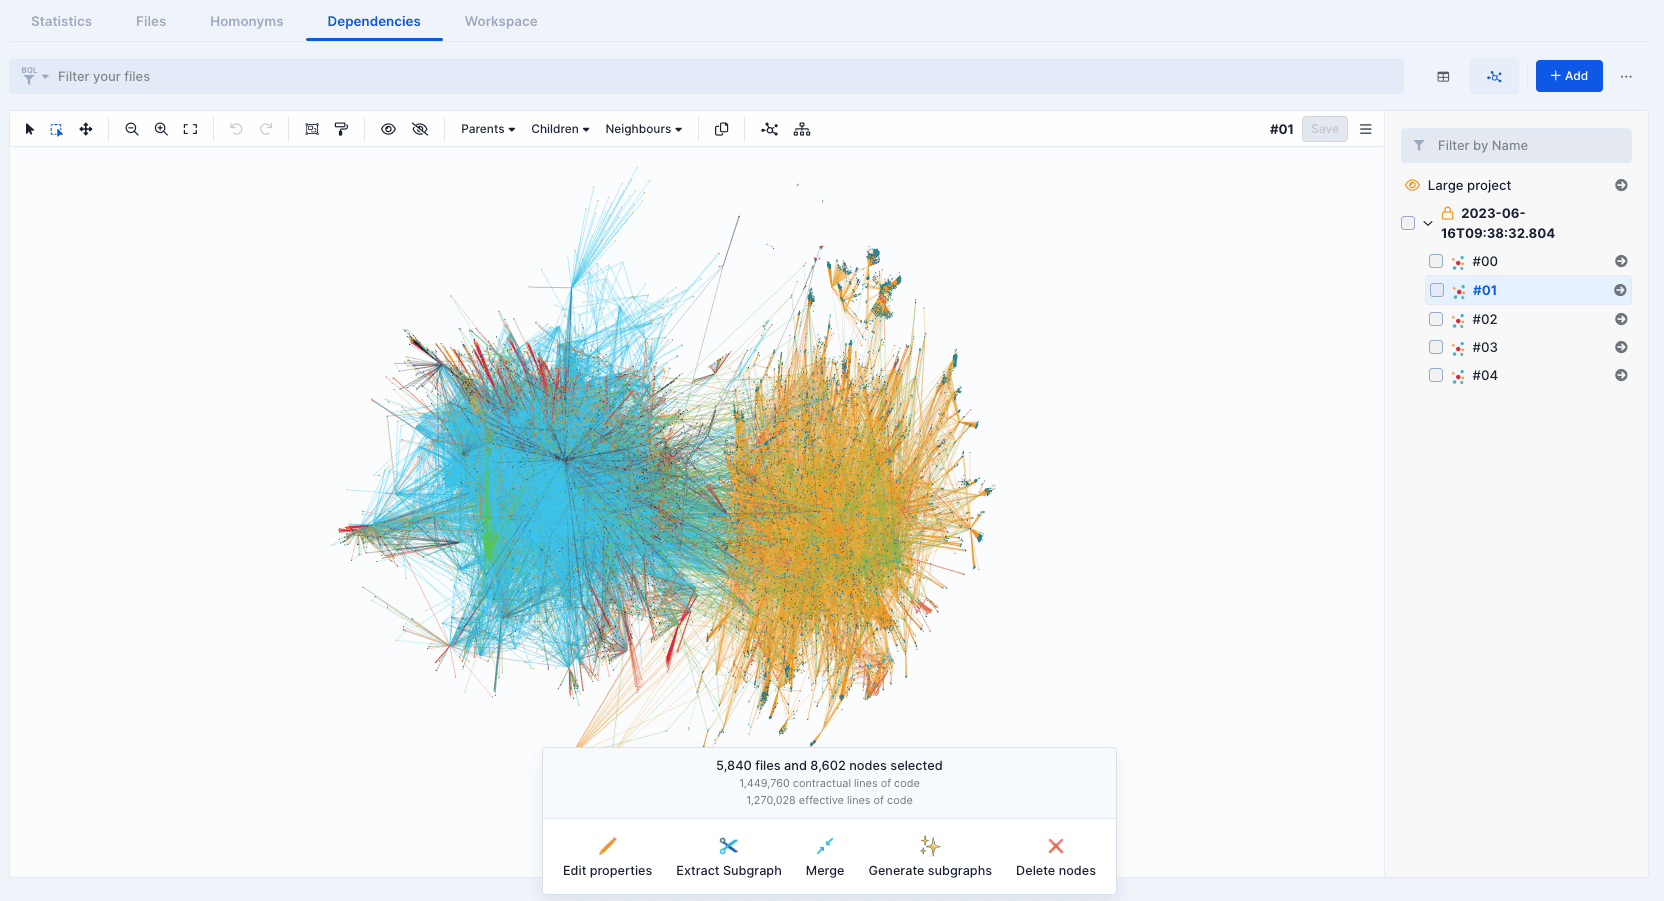
Can you guess how many nodes and edges does this graph contain? The exact answer is 1.5 million nodes and 2 million edges! That’s a lot of artefacts, and it’s not even the largest codebase we’ve seen in Blu Insights!
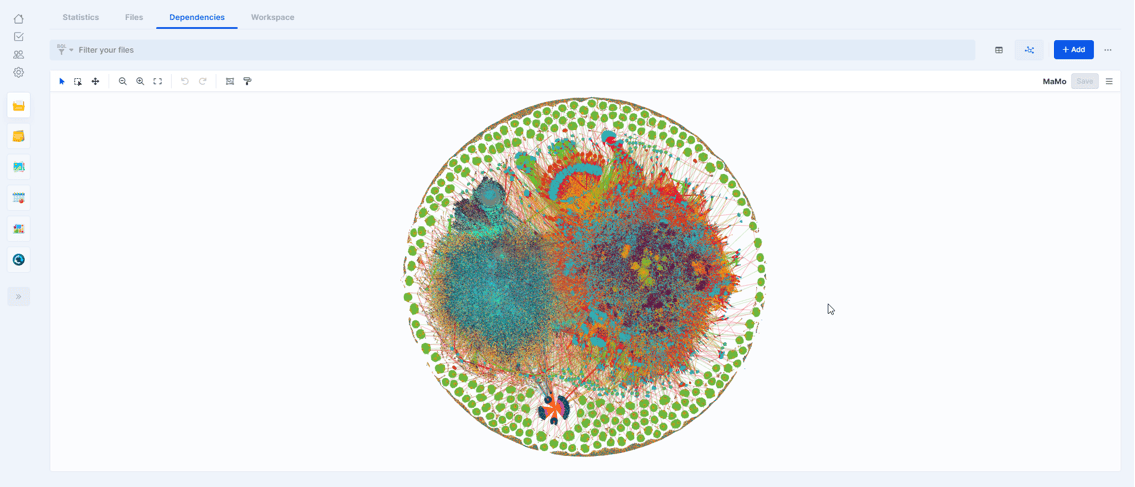
As of today, the record is held by a codebase with over 2 million nodes and 8 million edges. Customers are often amazed when they see it. While they’re aware of the size of their portfolio, most have never measured and visualized it.
Each of these artefacts has a set of properties, including its type, location (library), homonyms, business domain, feature, number of lines of code, parents, children, etc. All of these details need to be considered during the assessment phase.
Blu Insights offers a user-friendly filtering system based on BQL. It allows combining all of these properties and iteratively assess the codebase, breaking it down into smaller subgraphs based on the project’s modernization requirements (e.g. applications isolation, features, business domains, common modules, POC scope, etc.). Other features, like subgraph and group labeling, layout customization, and more, also help you dive deeper into large projects like these.
Users typically leverage all these tools to split this monster graph into smaller, manageable subgraphs. This exercise requires expertise, manual iterations, and patience.
Over the past few months, we’ve observed a panel of Blu Insights users with different profiles, including SDEs, business developers, SDMs, and more, with varying levels of expertise and time spent on modernization projects. We asked them for demos on concrete projects and asked them to identify the most repetitive and complex tasks. We also analyzed the most frequent questions we receive from trainees and new joiners.
Finally, we combined all of these insights and imagined how we can address those needs by leveraging automation to improve operational efficiency in the assessment phase.
Different features have already been released, requiring a re-architecture of the underlying dependencies management module. Among those features, we can mention “Graph Operations”, “Explore more links”, and “BI Builder” (more details will be provided in the upcoming days although the documentation is already up-to-date).
Today, we are excited to announce yet another new feature: Automatic constraints-based subgraphs extraction. 🎉
This feature enables you to automatically extract subgraphs by only specifying certain criteria. This tremendously simplifies the tedious process of manually selecting files and nodes when splitting a large graph.
To get started, simply select the files and nodes to extract from. Existing filtering techniques can be leveraged for that. For instance, functional labels filters can enable isolation of business domains and functional features. The resulting subgraphs will, by design, subscribe to a functional dimension.
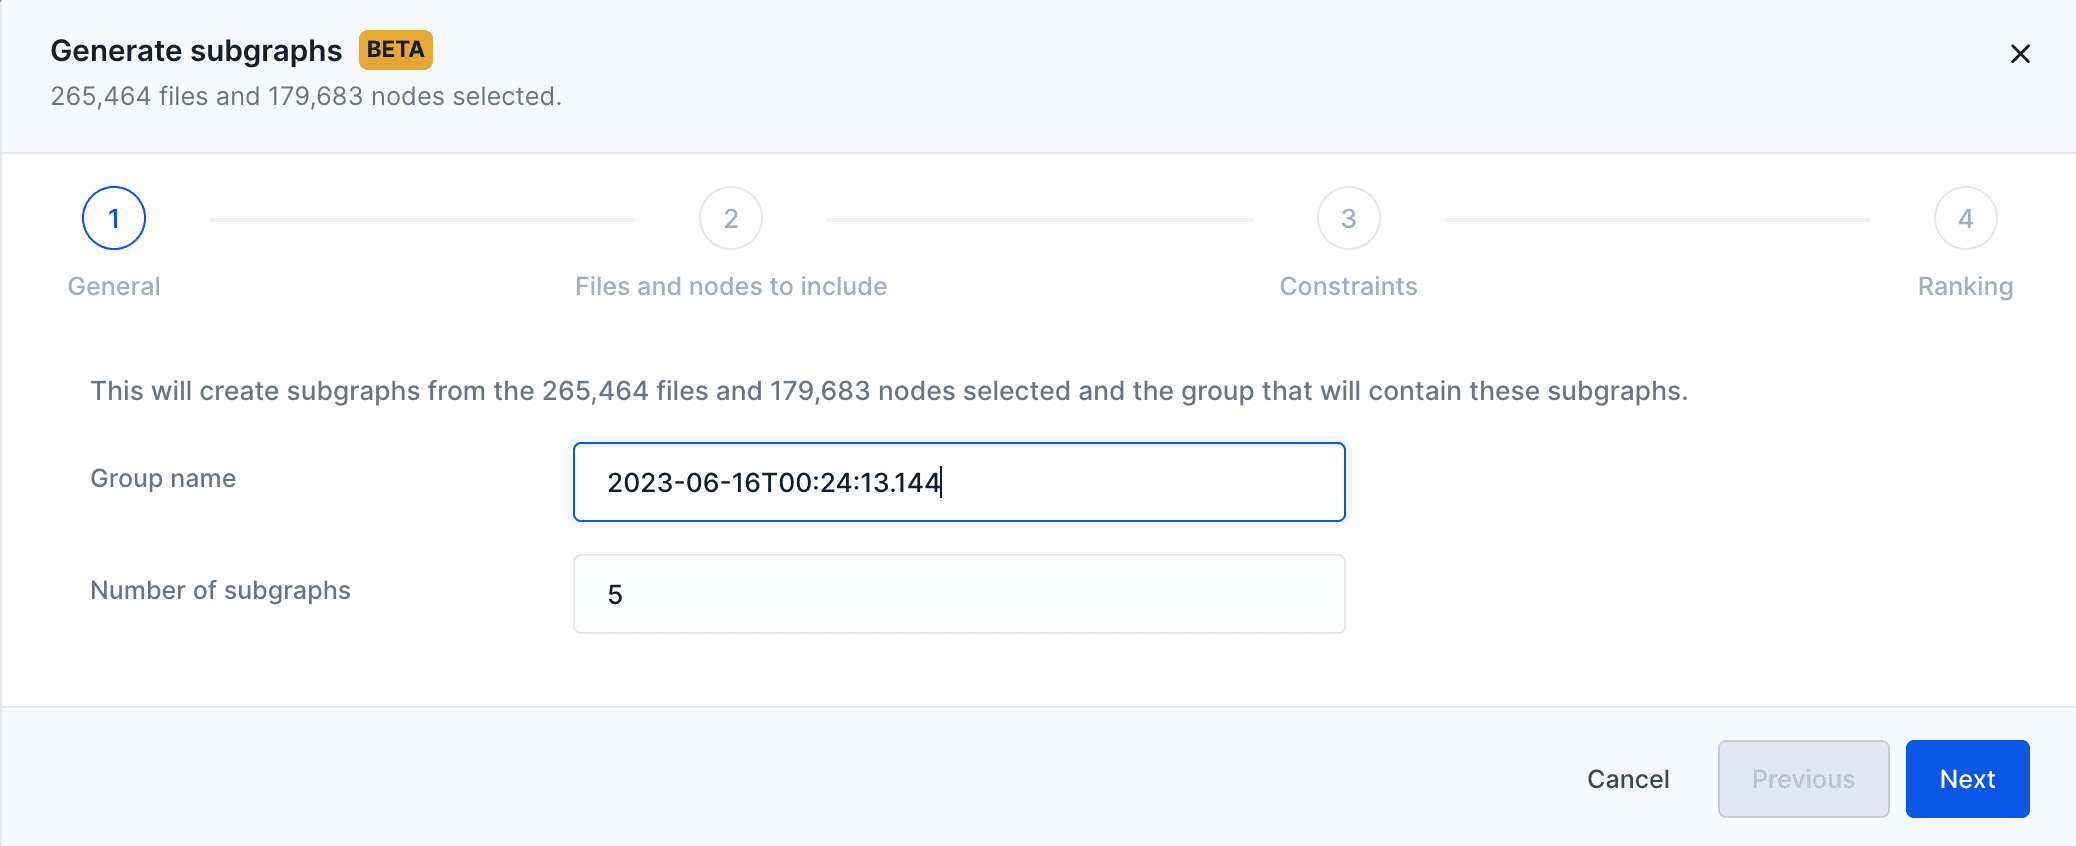
Then click on the “Generate subgraphs” option in the menu at the bottom and follow the configuration steps. For the purpose of this example, we keep the defaults for the first and second step.
On the constraints step, we specify our requirement to extract subgraphs that don’t exceed 6k files and 2 million effective lines of code. For perspective, this graph has over 250k files and 50 millions effective LOCs.
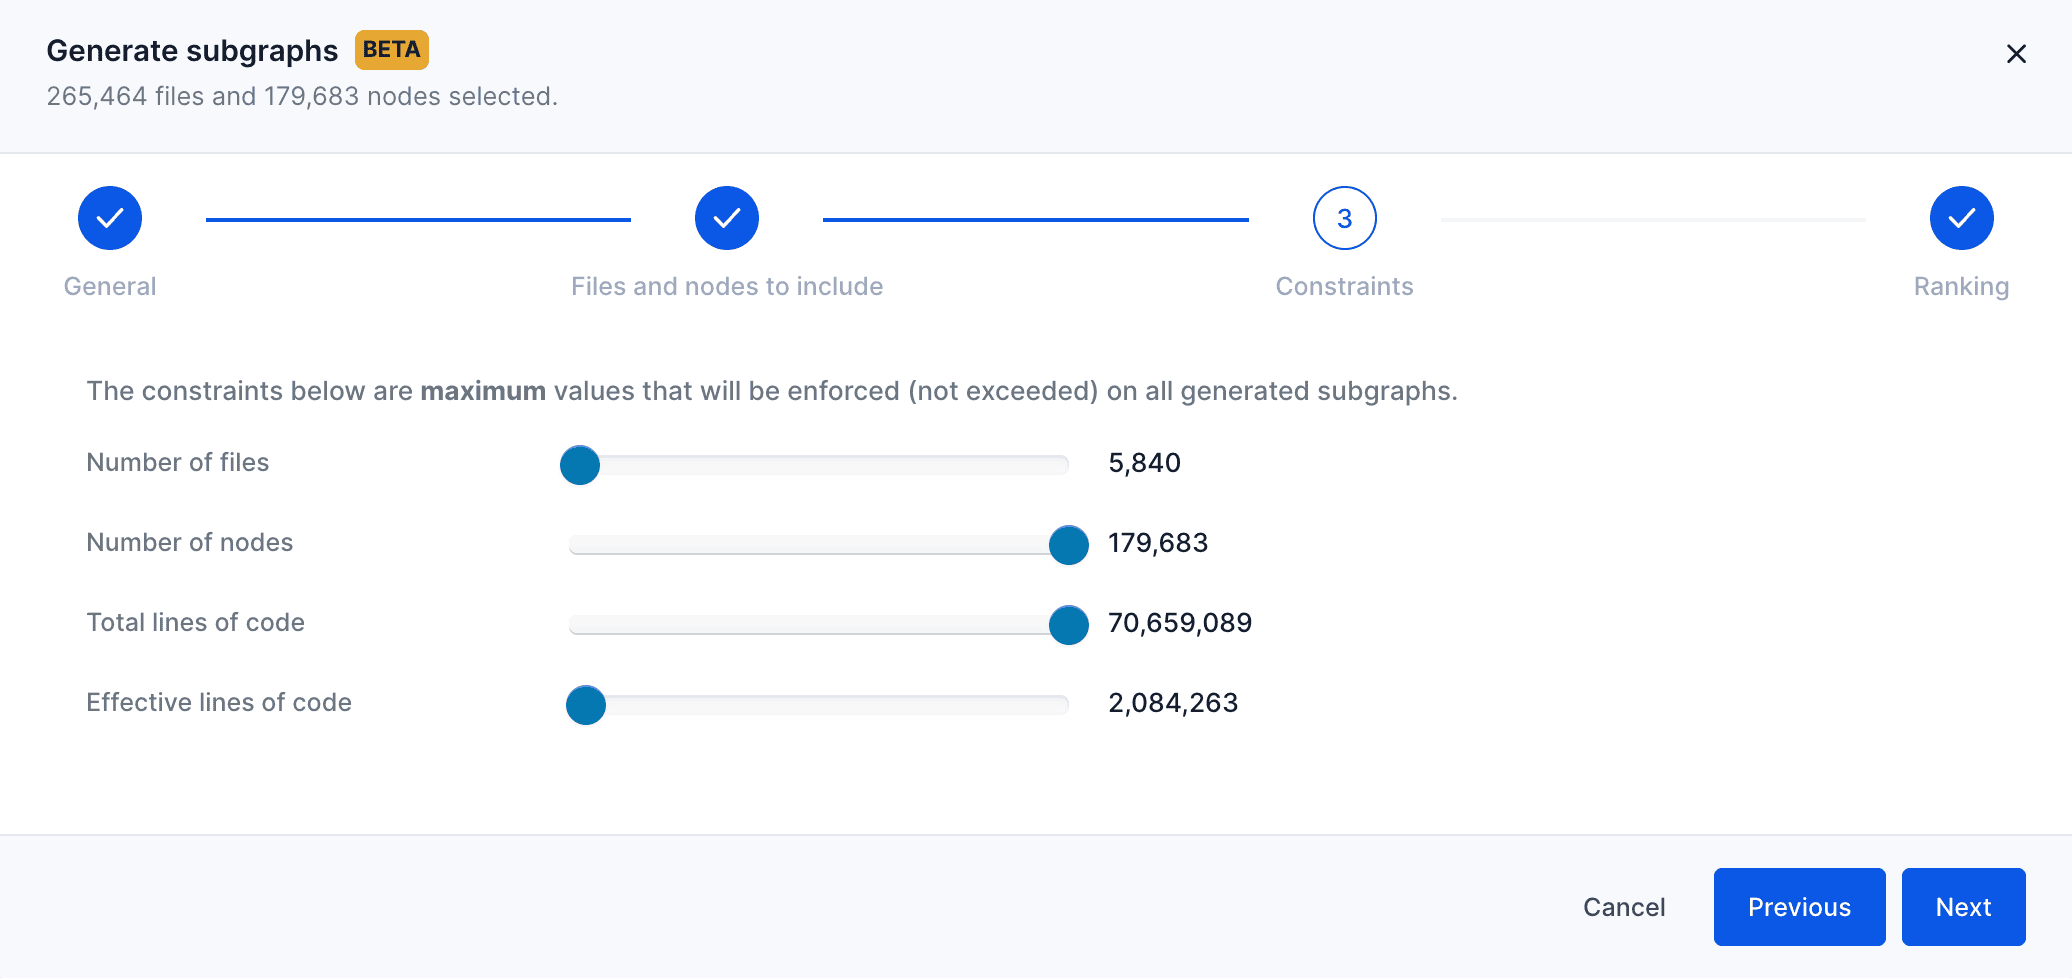
Under the hood, when the “Generate” button is clicked, over 50 subgraphs will be generated, scored with an internal scoring algorithm, then ranked based on their score. Finally, only the top 5 will be picked and proposed.
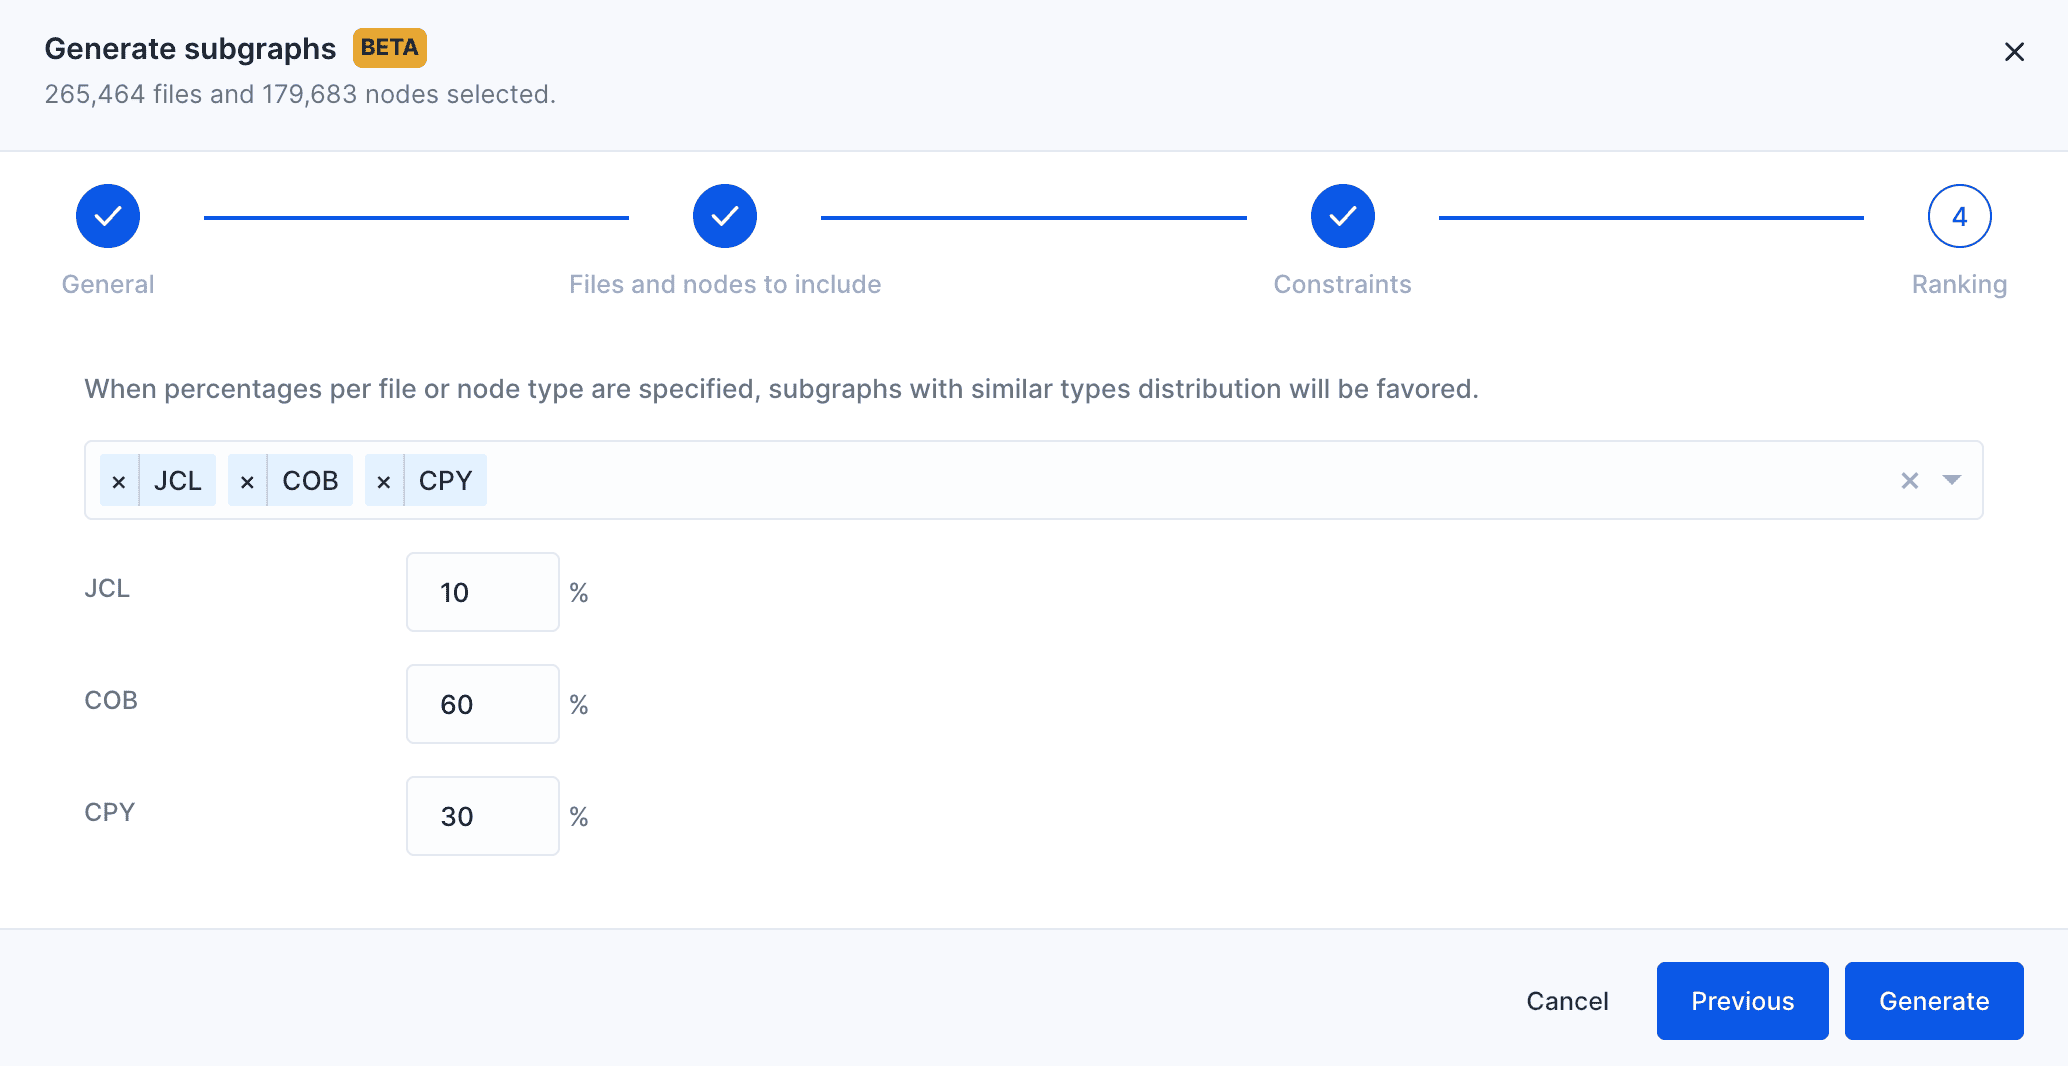
The scoring algorithm uses internal heuristics based on subgraphs metrics like size. We also expose a window for tweaking it by specifying your own ranking criteria based on file type distribution.
Once the subgraphs are extracted, they can be found in the group created especially for the occasion, and can be navigated and updated like any other manually extracted subgraph.
Cherry on top, the files and nodes are not picked arbitrarily: no file or node is included on the subgraphs without including all its dependencies (both direct and transitive). This enables the scope of the subgraph to be self-sufficient, i.e. no other file or node should be needed from the original graph.
As a bonus, notice that the subgraphs generation is also available directly on subgraphs. This means that it’s possible to iterate on the generated subgraphs and split them further until the functional and technical expectations are met.
Please note that, at the time of posting this article, the following feature was in beta testing phase, which means it may have undergone significant changes since then.
—
The Blu Insights team